App Inspector is a Google Chrome extension for debugging Sencha applications. It was contributed to primarily by Arthur Kay, Stefan Stölzle and Bruno Tavares. I’ve only found this extension recently but I wish I had it years ago, the purpose of this blog post is to convince you of why you need to be using it (and I don’t think it takes much convincing).
First of all, to install it you can download it from the Chrome Web Store here. Once it is installed, you can find it by opening up the chrome debugging tools (right click > Inspect Element). Right next to the Console tab you will find a new tab called ‘Sencha’ – that’s where all the magic happens.
Emulating devices to test your app…
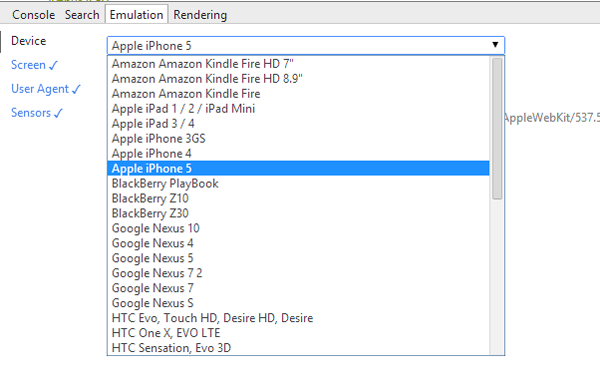
Before I get into all the debugging features, the coolest thing about App Inspector is the Emulation tab – this in itself is worth downloading the extension for. First of all, we can choose any of the devices shown in the image below, these include popular devices such as:
- iPhone 3, 4 & 5
- iPad & iPad Mini
- Blackberry
- Nexus
- HTC
This will resize the emulated screen to match the resolution of the chosen device. To see how your application looks on so many different devices in seconds is awesome. If you go to the ‘Screen’ section (just under ‘Device’) you are given more precise control over the screen to modify as you see fit.
If you pop on down to the ‘User Agent’ section you will notice you are able to spoof the user agent. We could make our application think we’re accessing it through Chrome, iOS or perhaps an Android device. This will come in very handy if you’re creating different profiles for different devices (i.e. a different layout for Android vs iOS).
Another cool feature under the Emulation tab is ‘Sensors’. This allows you to emulate the touch screen, geolocation and accelerometer. If you’re developing an application on your computer and wanted to test out geolocation, it’s a bit difficult to cart around the place (not to mention you’d actually have to go for a walk, what a waste of time!). App Inspector allows you to specify a latitude and longitude and your application will behave as if it is in that location. As well as that we can also modify the accelerometer values (or just drag the box alongside around to alter the values) if you’re making use of the accelerometer.
And some handy debugging tools…
In the picture below you will notice some tabs along the top, these include: App Details, Components, Stores, Layouts, Events. Of these, I’ve found the Components and Stores tabs to be especially helpful.
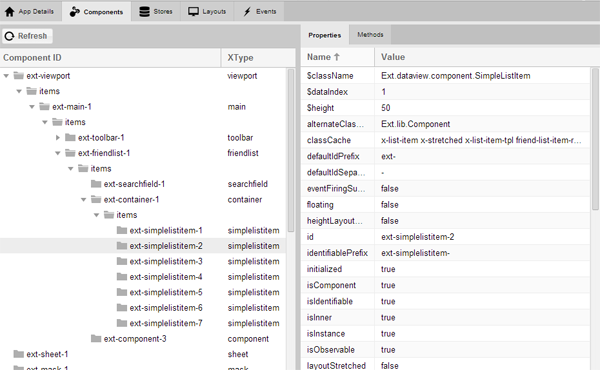
As I’m sure you have guessed, the Components tab shows all the components in the application. I can drill down into each component individually and investigate any items that belong to the component, and for each component I can see a detailed list of all its properties and methods. Take a look at the picture below:
Here you can see I have my viewport. Inside of that I have my main view, which in turn has two items: a toolbar and a list called ‘friendlist’. As you can see in the picture, I can keep drilling down further until I reach the individual list items.
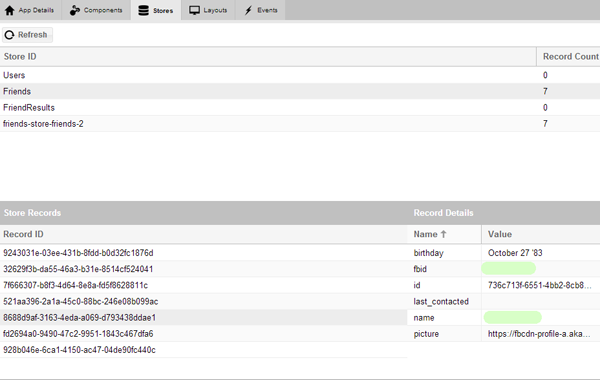
The ‘Stores’ tab is also just as useful and again, I’m sure you’ve figured out that it’s used to inspect the stores in your application. At the start we can see each of the stores that are available and a count of all the records that they are holding. If we click on one of those stores, a list of all the records in that store will pop up and we can select each one to inspect the values they’re holding.
Considering how useful this extension is, I can’t believe I’ve only started using it recently. If I had have had this a long time ago I think I would have saved myself a lot of time and effort in debugging. So in conclusion: if you don’t already have it, you need to go install App Inspector!
Are you already using App Inspector? What do you like about it?


